Physics-based SoH from live telemetry — not firmware lookup tables.
Every BMS ships with SoH curves calibrated at 25°C on factory cells. Your BESS operates at ambient, at variable DoD, at charge rates the factory never characterised. Cellanchor re-derives SoH from first-principles electrochemistry against your own DNP3/IEC 61850 telemetry — closing the gap that compounds to >12% measurement error by year 3 of operation.
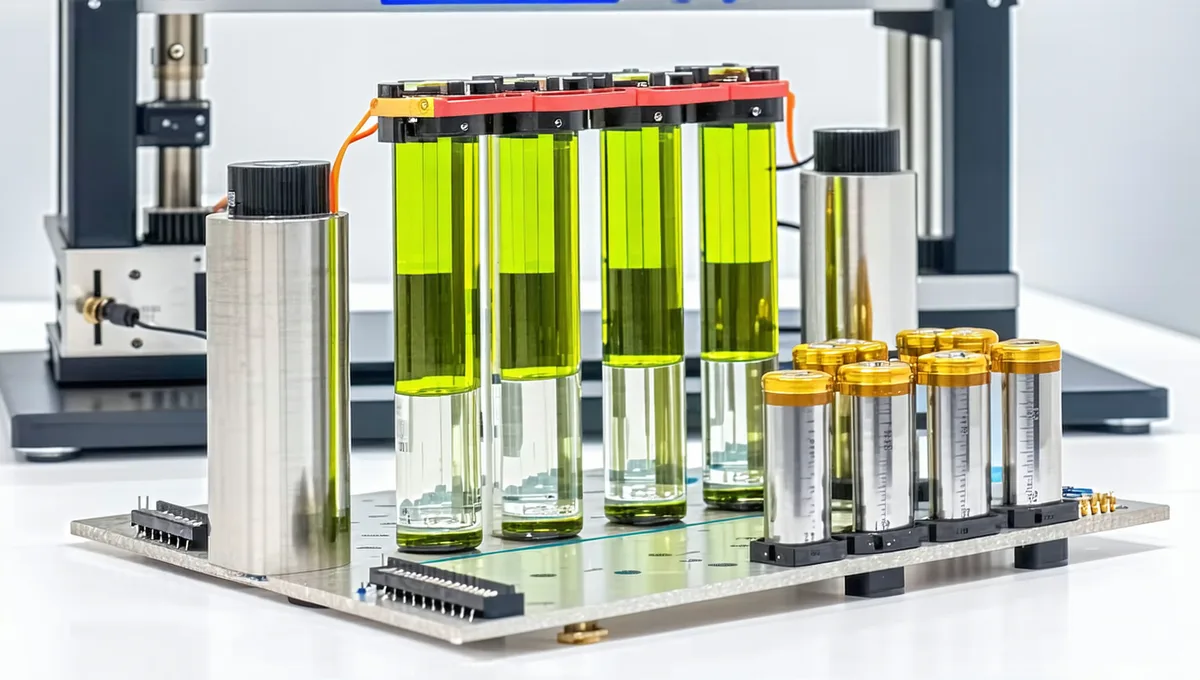
The SoH model basis.
Why first-principles beats empirical lookup
Manufacturer SoH curves are calibrated at 25°C on fresh cells from a factory batch. Your utility-scale BESS runs at varying ambient temperatures, charge rates, and depth-of-discharge patterns that were never in the manufacturer's test protocol.
Cellanchor's model starts from fundamental electrochemical principles — diffusion kinetics, intercalation thermodynamics, interface impedance growth — and re-derives SoH from your asset's actual operating history.
Model validation approach
For each new asset deployment, Cellanchor's model is initialised with manufacturer datasheet parameters, then iteratively updated as operating telemetry accumulates. Validation is continuous — model-predicted SoH is compared against capacity-fade measurements on scheduled offline test cycles where available.
The result is a SoH estimate that tracks actual capacity with <3% RMSE on validated pilot deployments, versus >12% typical error on BMS-reported values at year 3+ of operation.
Protocol-first telemetry ingestion.
We ingest directly from inverter SCADA interfaces — no intermediate gateway required for standard protocol deployments.
Calendar aging and cycle aging — modelled separately, combined correctly.
Arrhenius temperature model
Calendar capacity fade is modelled using the Arrhenius equation applied to electrolyte decomposition and SEI layer growth rates as a function of ambient temperature and average SoC.
Rainflow cycle counting
Every discharge cycle is decomposed using Rainflow counting into half-cycles by depth-of-discharge. Degradation contribution per cycle is read from the manufacturer's DoD curve (or a fitted generalised Wöhler curve if not provided).
Model predicted vs. measured SoH.
Validation data from pilot deployments (synthetic data shown — actual results under NDA).
Questions about the electrochemical model? Talk to the team.
Pilot partners receive the full methodology documentation including model equations, calibration procedure, and validation data — under NDA. We do not rely on black-box scoring that operators cannot audit.