Sometime in 2022 I spent three weeks inside a post-mortem on a 14 MW BESS that had tripped on thermal protection. The operator's SCADA log showed nothing alarming in the days before the event — pack voltage had stayed within ±2% of nominal, temperatures looked fine, and the BMS had flagged exactly zero anomalies. It was only when we went back through the raw cell-level CSV exports from the site historian that we found the precursor signatures: two cells in rack 7 had been drifting for six weeks, their incremental capacity curves slowly flattening while the pack-level metrics remained calm.
That disconnect — between what pack voltage shows you and what the cells are actually doing — is the central problem with how most grid-scale BESS sites are monitored today. This article explains the mechanism behind it, and what operators need to do differently.
Why Aggregate Voltage Is Structurally Misleading
A modern lithium-ion BESS rack is a series string of individual cells, typically 16 to 32 cells per module, dozens of modules per rack. The terminal voltage the BMS reports is the sum of every cell in series. That arithmetic is also the source of the diagnostic blind spot.
When one cell degrades — losing capacity to SEI layer growth, lithium plating, or electrolyte decomposition — the rest of the string compensates. Healthy cells charge and discharge across a larger SoC window to make up for the degraded cell's reduced contribution. To the pack-level voltage sensor, the string still looks like a working battery. Capacity measurements taken at low resolution won't catch the drift until the weak cell is so far gone that it limits the string's usable range noticeably.
In our experience examining degradation data from fielded systems, a single cell can lose 15–20% of its original capacity before that loss shows up as more than a 1–2% deviation in pack-level metrics. At that point, the degradation process is often already irreversible under normal operating conditions.
The dQ/dV Signal Pack Voltage Hides
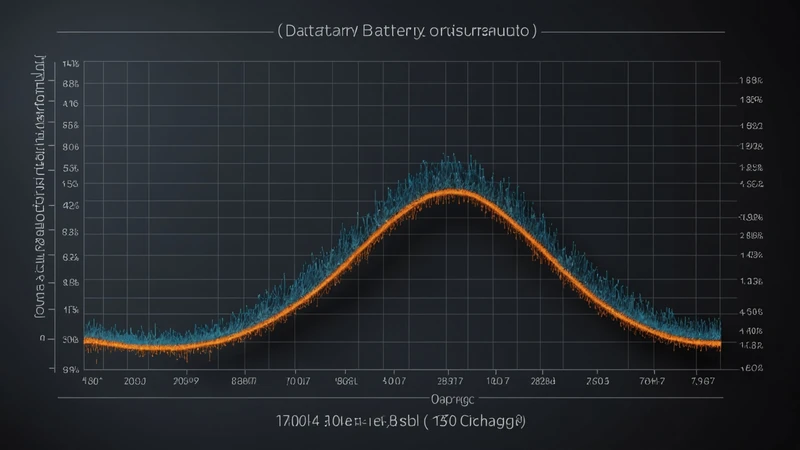
Incremental capacity analysis — plotting dQ/dV, or the derivative of charge capacity with respect to voltage — is one of the more reliable ways to track electrochemical aging mechanisms at the cell level. Healthy NMC cells show distinct peaks in their dQ/dV curves corresponding to phase transitions in the cathode material. As the cell ages, those peaks shift in position, decrease in amplitude, or merge together. The specific pattern tells you something about the degradation mechanism: peak shift to lower voltage typically indicates SEI growth and lithium loss; peak amplitude collapse often signals active material dissolution or structural disorder in the cathode.
The problem is that dQ/dV analysis requires per-cell voltage resolution at 10 mV or better, sampled during a full charge-discharge cycle. Pack-level BMS firmware does not give you this. What you get is an averaged, smoothed voltage curve that washes out the individual cell signatures entirely. You can tell something about the pack's overall SoH trajectory from pack-level capacity measurements, but you cannot localize which cell is responsible, which degradation mechanism is active, or how far along the progression is.
This matters operationally because the intervention changes depending on the mechanism. Lithium plating — which happens when cells are repeatedly charged too fast or at low temperatures — is reversible in early stages through a controlled low-current conditioning cycle. Cathode material dissolution is not reversible; it tells you to plan that module for replacement within the next maintenance window. Without cell-level dQ/dV resolution, you cannot distinguish between the two.
Cell Voltage Spread: The Number Most BMS Firmware Underreports
Most BMS platforms report minimum cell voltage, maximum cell voltage, and the delta between them — cell voltage spread. This number is more informative than pack terminal voltage, but it is frequently underreported or misinterpreted in practice.
Manufacturers typically specify a maximum allowed voltage spread of 50–100 mV at end of charge as a warranty parameter. In our data from operational LFP systems, voltage spreads above 30 mV at end of charge correlate with measurable capacity imbalance between cells, and spreads above 60 mV are a reliable leading indicator that one or more cells will reach voltage cutoff prematurely during discharge — forcing the whole string offline before the rest of the pack is actually depleted.
The operational cost of this is real. A 100 kWh rack where two cells are consistently hitting low-voltage cutoff 8–10% early is delivering around 90–92 kWh of usable energy — but the BMS is still reporting the system as "operational" at its nameplate rating. Multiply that across a 50-rack system and you have capacity degradation that nobody has formally acknowledged or accounted for in the project's revenue model.
What changes with per-cell monitoring is that the spread is tracked at the individual cell level, not just as a min/max pair. You can identify which specific cells are causing the spread, trend their drift over time, and differentiate between a cell that is genuinely degrading versus a cell that has a loose connection causing a contact resistance artifact. Those two conditions look identical in a min/max spread report; they do not look identical in per-cell voltage time series.
Calendar Aging vs. Cycle Aging: What Pack Voltage Cannot Tell Apart
Battery degradation has two primary drivers: calendar aging (time-dependent capacity and resistance growth regardless of how much the battery is cycled) and cycle aging (degradation proportional to charge-discharge throughput). For asset management decisions, knowing the split matters.
A BESS deployed in a frequency regulation application accumulates hundreds of shallow cycles per day. A BESS used for peak shifting might cycle once per day at deep discharge. Both might show the same pack-level capacity after two years, but through completely different degradation pathways — and with very different projections for remaining useful life. The frequency regulation system has consumed its cycle budget rapidly but preserved its calendar life budget; the peak-shifting system has done the reverse.
Disentangling calendar from cycle contributions requires cell-level telemetry: accurate coulomb counting per cell, temperature exposure history at each cell's location in the rack (hotspots age faster even under identical electrical loading), and internal resistance measurements over time. Pack voltage gives you none of this. It gives you the end result of both processes combined, with no way to apportion the contribution or project forward by mechanism.
What Cell-Level Resolution Changes Operationally
Moving from pack-level to cell-level monitoring changes several things that matter to BESS operators:
- Early fault localization. When an anomaly appears, you know immediately which rack, which module, which cell — not which system. The difference between "something is wrong somewhere in site 3" and "cell 14 in module 6 of rack 7 has a plating signature" is the difference between a 25-hour investigation and a 20-minute dispatch decision.
- Chemistry-appropriate thresholds. LFP and NMC cells degrade differently and warrant different alert thresholds. Cell-level monitoring lets you set thresholds against the actual electrochemical behavior of each chemistry in the rack, rather than applying generic pack-level limits that were written for a different cell type.
- Warranty evidence that holds up. Manufacturer warranty claims require demonstrating that cells were operated within specified voltage, temperature, and current limits throughout the warranty period. Cell-level logs are the only way to make that demonstration with the granularity manufacturers actually require during dispute resolution.
- Predictive maintenance timing. Capacity fade curves at the cell level let you project when a specific cell or module will fall below a usable capacity threshold, allowing you to plan replacement during a scheduled outage window rather than responding to an unplanned shutdown.
None of this requires new hardware. Modern BMS platforms from most major vendors already log cell-level voltage at 1–10 Hz; the telemetry is there. The gap is in the analytical layer that reads those streams and extracts the electrochemical meaning from them.
Where Operators Should Start
If you're running a grid-scale BESS today and relying primarily on pack-level SCADA readings for health assessment, the most practical first step is auditing what your BMS is actually logging at the cell level and whether that data is making it into your historian at sufficient resolution.
Many sites collect cell-level data in the BMS but aggregate it before it reaches the SCADA or historian, either to reduce data volume or because no one configured the historian to store the raw streams. That data still exists in the BMS buffer — typically for 30–90 days depending on the firmware — but it is not being used. Recovering it and running even basic trend analysis on cell voltage spread and capacity fade per module will usually surface something actionable within the first review.
The second step is establishing baselines. Cell-level health diagnostics are most useful when you have historical context: what did cell voltage spread look like at commissioning, at six months, at one year? Without baselines, you are watching a number without knowing whether it represents normal variance or the start of a real drift. Taking those baseline snapshots at commissioning and after each major cycling regime change takes about 30 minutes of attention and pays dividends for the life of the asset.
Pack voltage will keep telling operators that everything is fine right up until it isn't. The cells have been trying to tell a different story the whole time — the question is whether your monitoring stack is listening at the right resolution.